The retatrutide Phase 2 trial (Jastreboff et al., NEJM, August 2023) produced the largest weight loss ever documented for a drug at the time of publication. Whether the number holds at Phase III scale is the most-watched question in metabolic medicine. This article examines what the trial reported and what Phase III TRIUMPH is positioned to show.
Jastreboff and colleagues randomized 338 adults with obesity to retatrutide 1 mg, 4 mg, 8 mg, 12 mg, or placebo over 48 weeks. Enrollment required BMI ≥30, or ≥27 with at least one weight-related comorbidity. At the highest dose, mean weight loss was 24.2%. 83% of participants on that dose achieved ≥15% weight loss. Dose-response was clean and roughly linear up to 12 mg. GI adverse events were class-typical: dose-related, mostly mild-to-moderate. A dose-dependent heart-rate increase peaked at week 24 and then declined. That’s the cardiovascular signal Phase III TRIUMPH is positioned to characterize.
The Phase II trial is a structurally different animal from Phase III. Phase II trials typically over-report efficacy relative to Phase III. Smaller sample sizes (n=338 vs. n=2,500+ in SURMOUNT-1) produce more noise in the mean. More rigorous adherence support at trial sites produces better protocol adherence. Selection effects in early-stage enrollment skew toward responders.
Our honest expectation for retatrutide Phase III TRIUMPH is some regression in the headline number. The result could land closer to 18–22% mean weight loss at scale rather than 24.2%. That would still be category-leading. It changes the framing only modestly.
This article covers the trial design, the dose-response curve, the GI tolerability breakdown by dose, the heart-rate signal, cross-trial comparisons against tirzepatide and CagriSema, and what Phase III TRIUMPH specifically needs to demonstrate.
How was the Phase II trial designed?
The Jastreboff et al. trial was a phase 2, double-blind, randomized, placebo-controlled, parallel-group, dose-finding trial. Participants were randomized 2:1:1:1:1:1 to placebo or one of 5 retatrutide dose arms. The active arms were 1 mg, 2 mg starting / 4 mg target, 4 mg starting / 8 mg target, 2 mg starting / 8 mg target, and 4 mg starting / 12 mg target. Dosing was subcutaneous once weekly over 48 weeks.
For analytical clarity, the published paper grouped doses into 1 mg, 4 mg, 8 mg, and 12 mg target-dose arms. The combined arms approach lets the dose-response curve become visible across the range while preserving statistical power.
Key eligibility criteria:
- BMI ≥30 kg/m², or BMI ≥27 kg/m² with at least one weight-related comorbidity.
- Adults aged 18–75, with weight stable for at least 3 months.
- No T2D. Participants with T2D were studied separately in retatrutide’s T2D Phase II.
The dose-titration protocol used gradual escalation over the first 12 weeks to reach target dose. It was designed specifically to mitigate the dose-dependent GI tolerability that would otherwise be limiting. That titration-mitigation finding is one of the underappreciated contributions of the trial. Slow titration kept most participants on the highest-dose arm through 48 weeks.
Primary endpoint was percent change in body weight from baseline at week 24, the dose-response endpoint. Secondary endpoints included week-48 weight change, threshold response across multiple percentage thresholds, and cardiometabolic risk-factor changes.
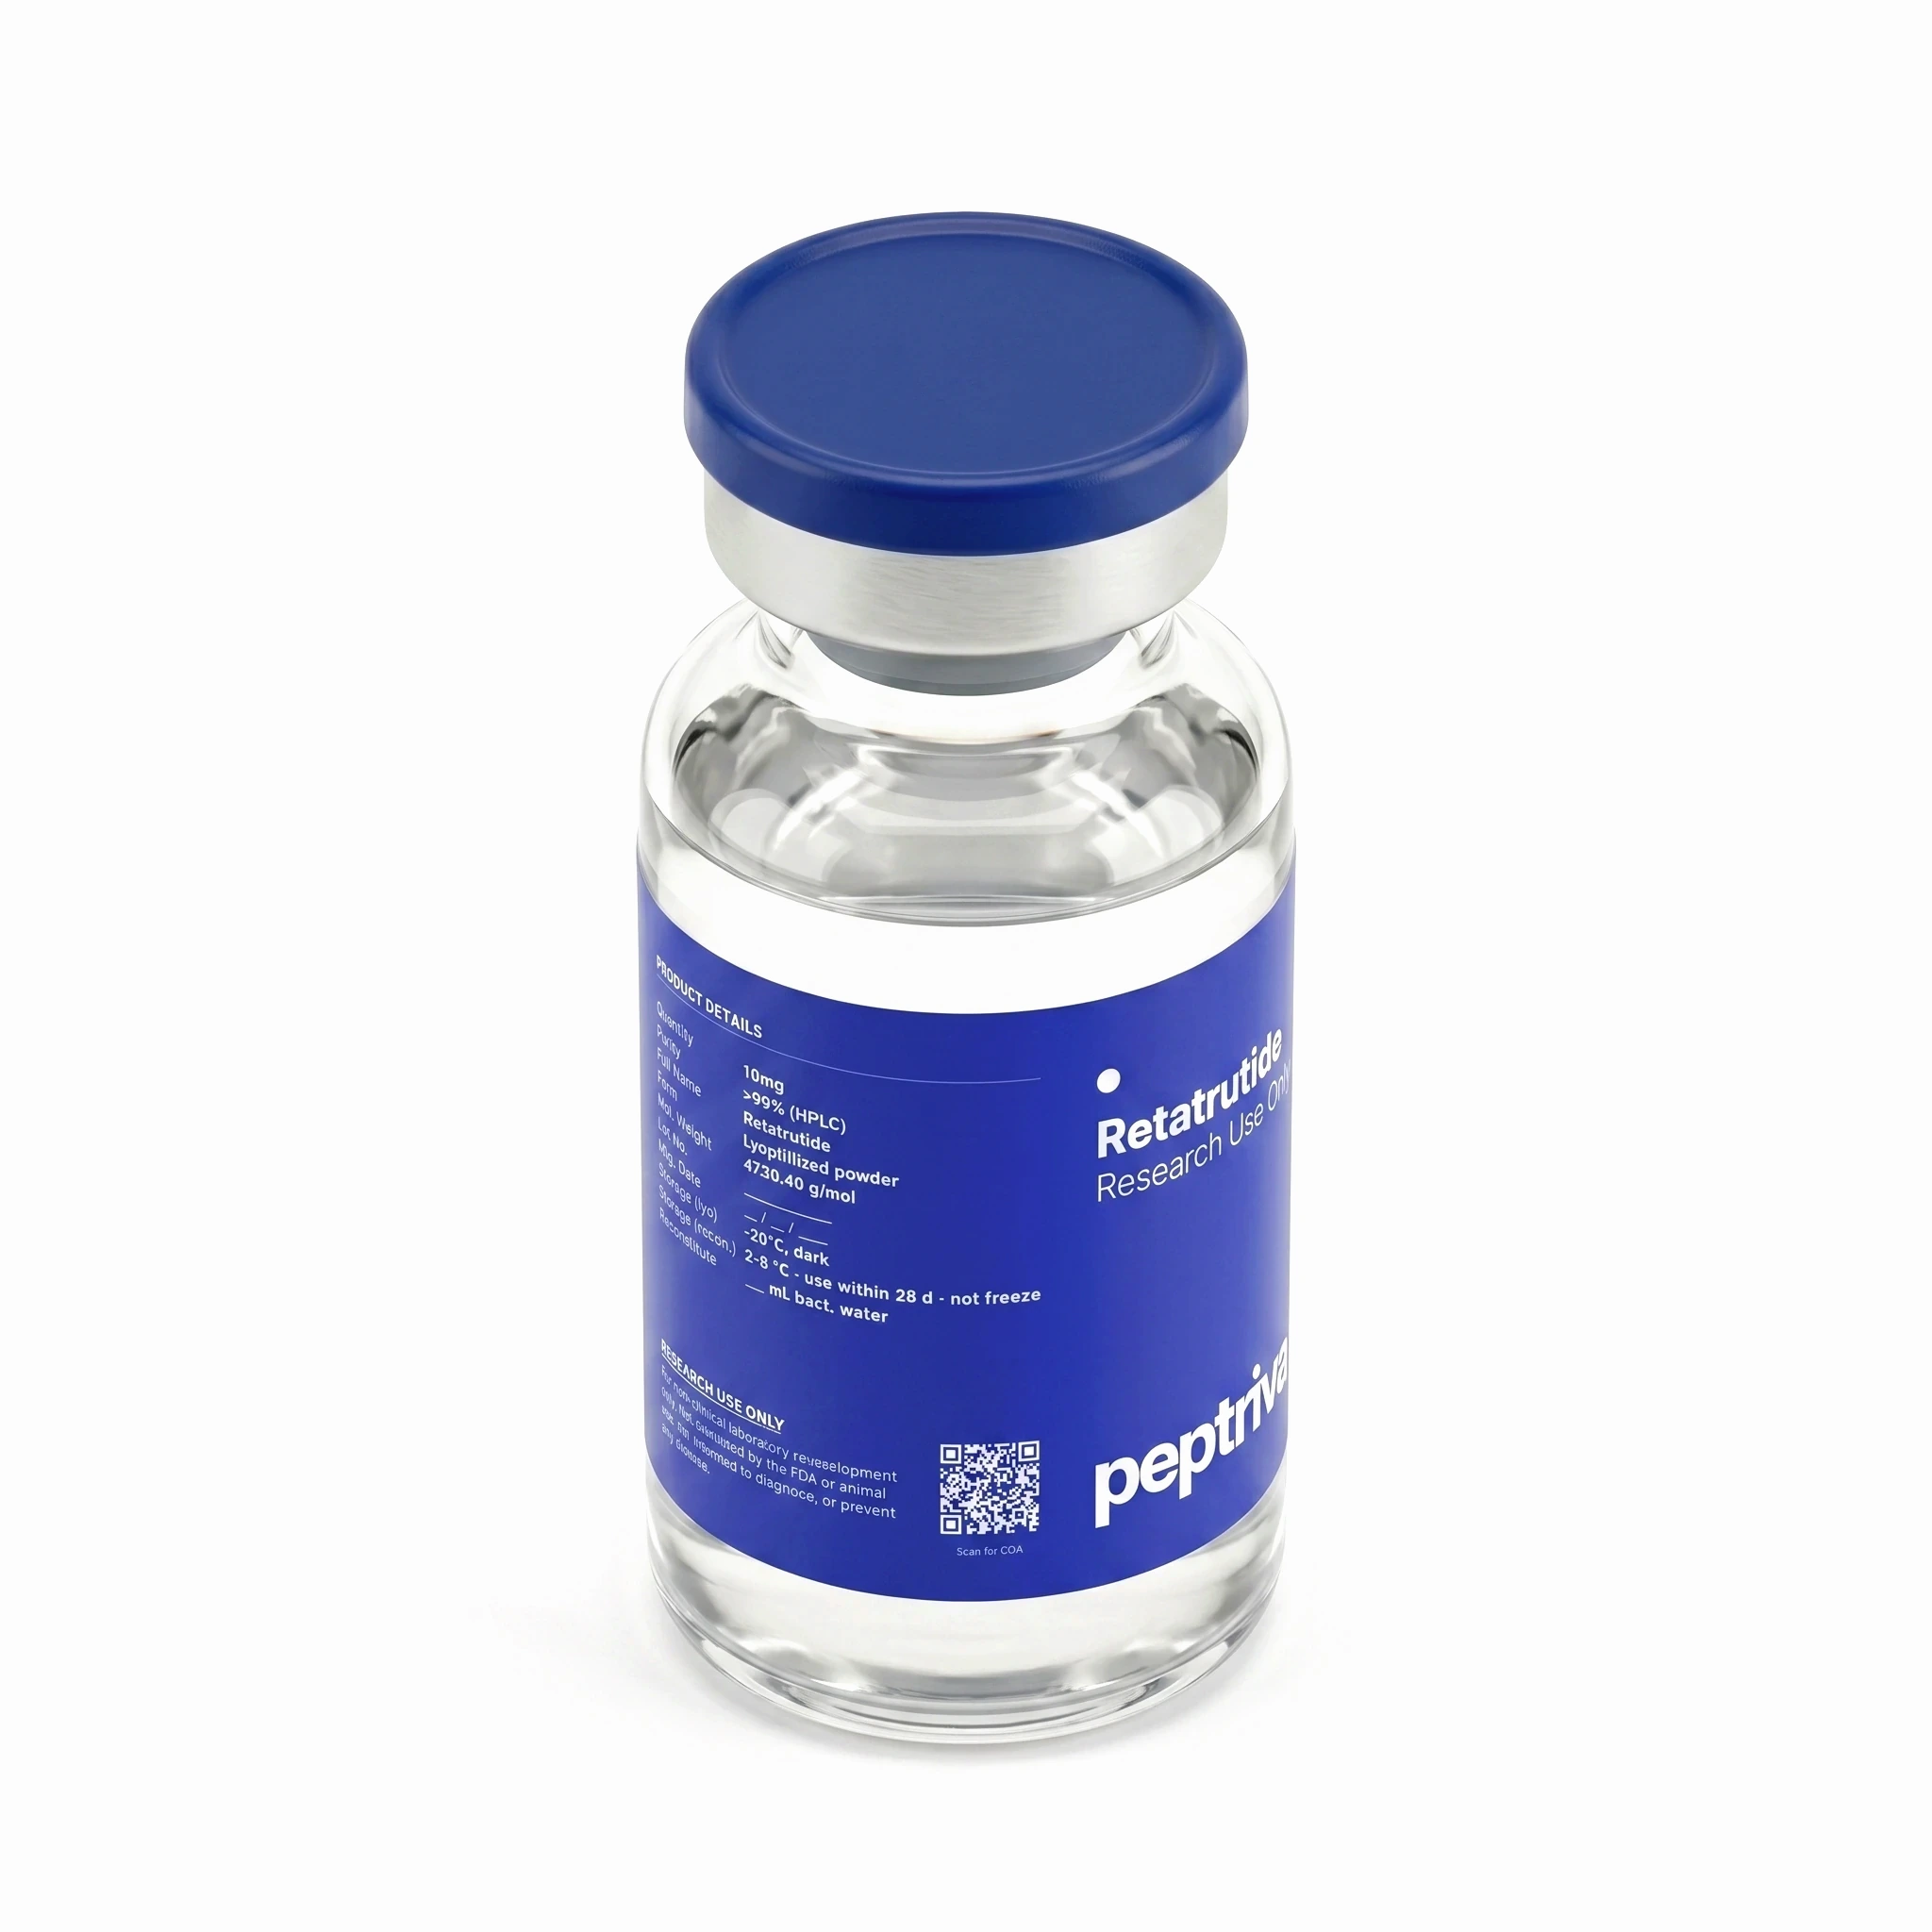
Retatrutide
The same compound cited across the Jastreboff Phase II trial in this deep dive. Lab-verified identity and purity.
What did the dose-response curve look like?
The published weight-loss numbers at week 48, by arm:
- Retatrutide 12 mg: −24.2% mean weight change. The headline number.
- Retatrutide 8 mg (combined): −22.8% mean weight change.
- Retatrutide 4 mg (combined): −17.1% mean weight change.
- Retatrutide 1 mg: −8.7% mean weight change.
- Placebo: −2.1% mean weight change.
The dose-response curve is notable for several reasons. First, the slope is steep through the 1 mg, 4 mg, and 8 mg arms, with meaningful weight-loss differences at each dose increment. Second, the slope flattens between 8 mg and 12 mg, but doesn’t obviously plateau. The 12 mg arm still produced more weight loss than the 8 mg arm. Whether higher doses would unlock additional weight loss in Phase III is an open question. The compound may not have hit its biological ceiling at 12 mg.
The threshold-response data is where individual variance becomes visible:
- ≥5% weight loss at 12 mg: 100% of participants vs. 27% on placebo.
- ≥10% weight loss at 12 mg: 93% vs. 9%.
- ≥15% weight loss at 12 mg: 83% vs. 2%.
- ≥20% weight loss at 12 mg: 63% vs. 0%.
- ≥25% weight loss at 12 mg: 48% vs. 0%.
The 83% of study participants reaching ≥15% weight loss is the threshold-response number that subsequent durability studies have associated with cardiometabolic risk-factor improvements. Nearly half of all 12 mg participants reached ≥25% weight loss — a magnitude that prior literature had associated primarily with bariatric surgical outcomes.
What did the GI adverse-event profile look like?
The GI tolerability profile in the Phase II trial was the standard for the dual and multi-agonist class. Events were dose-dependent, mostly mild-to-moderate, and partially mitigated by slow dose titration. They predominantly occurred during the dose-escalation phase of the trial.
The proportion of participants reporting at least one GI adverse event by dose:
- Placebo: approximately 40%.
- Retatrutide 1 mg: approximately 53%.
- Retatrutide 4 mg: approximately 73–79%.
- Retatrutide 8 mg: approximately 73–81%.
- Retatrutide 12 mg: approximately 81–85%.
The specific events at the 12 mg dose tracked with the class. Nausea hit approximately 50%. Diarrhoea, 38%. Vomiting, 37%. Constipation, 25%. Most events were grade 1 or 2 (mild to moderate). Severe (grade 3+) GI events were uncommon but not negligible at the highest doses.
Treatment discontinuation due to adverse events occurred in roughly 6–16% of participants across the retatrutide arms, increasing with dose. That’s higher than tirzepatide’s SURMOUNT-1 at 4–7%, but not dramatically so. The smaller sample size makes Phase II discontinuation rates somewhat noisy.
The most common adverse events with retatrutide were gastrointestinal, dose-related, and mostly mild-to-moderate. Dose-dependent increases in heart rate peaked at 24 weeks and then declined. The slow-titration protocol was effective at keeping the majority of participants on the highest-dose arm through 48 weeks.
— Jastreboff et al., NEJM, 2023 (paraphrased summary)
What was the heart-rate signal?
This is the cardiovascular safety question that Phase III TRIUMPH is specifically positioned to characterize. The Phase II trial documented a dose-dependent heart-rate increase across the retatrutide arms. It peaked around week 24 and then declined toward baseline by week 48.
The mechanism is presumed to be glucagon-receptor-driven cardiac effects. That’s consistent with the broader pharmacology of the glucagon arm, which increases energy expenditure and cardiac output. The peak magnitude at 12 mg was modest in absolute terms, a single-digit beats-per-minute increase from baseline. But the dose-response and timing pattern were both consistent enough to warrant Phase III characterization.
Why the heart-rate signal matters: in a 338-participant Phase II trial, this kind of signal is mostly a hint. The sample size is too small to detect clinically meaningful cardiovascular events. In a 5,000+ participant Phase III trial with multi-year follow-up, the same signal becomes either reassuringly transient or genuinely problematic. The fact that the Phase II curve peaked then declined is encouraging. Whether that pattern holds at scale is the open question.
It’s worth noting that the heart-rate signal didn’t gate continued development of retatrutide. Eli Lilly has moved aggressively into the TRIUMPH Phase III program. That decision is a regulatory and clinical judgment that the Phase II signal warrants characterization but doesn’t flag a stop-development concern. Phase III will produce the data that confirms or revises that judgment.
How does this compare across the class?
Cross-trial comparisons need to be read with awareness of methodological asymmetries, but they’re useful for orienting the trial in the broader landscape:
- Retatrutide 12 mg, Phase II (2023): 24.2% mean weight loss at 48 weeks (n=338).
- Tirzepatide 15 mg, Phase III SURMOUNT-1 (2022): 22.5% at 72 weeks (n=2,539).
- Semaglutide 2.4 mg, Phase III STEP-1 (2021): 14.9% at 68 weeks (n=1,961).
- CagriSema, Phase III REDEFINE-1 (2025): 20.4% at 68 weeks (n=3,417).
The 24.2% retatrutide number is the highest in the comparison set. But it’s also the only Phase II result. Phase II vs. Phase III is a structural unfairness that’s easy to miss. 3 factors typically push Phase II numbers higher than the eventual Phase III number:
- Smaller sample size produces more variance. With 338 participants, a few high-responders can pull the mean meaningfully higher. In SURMOUNT-1’s 2,539 participants, that effect washes out.
- More rigorous adherence support. Phase II trials at academic medical centers have closer follow-up than Phase III trials at community sites. The result is better protocol adherence and somewhat higher efficacy.
- Selection effects in early enrollment. Early-stage trial participants are often more motivated and more carefully selected than the eventual broader-population enrollment in Phase III.
The realistic expectation for retatrutide Phase III TRIUMPH-1 is some regression from 24.2%. The likely range is 18–22%. That would still be category-leading. The bigger question is whether the 24.2% Phase II number is a directional preview of even higher Phase III readouts, or a structural over-statement that regresses to tirzepatide-equivalent territory.
What does Phase III TRIUMPH specifically need to show?
The TRIUMPH program is Eli Lilly’s Phase III development plan for retatrutide. 6 key questions it needs to answer:
- Does the headline weight-loss number hold up at scale? The trial uses n=2,500+ in obesity with multi-year follow-up. Anything ≥20% mean weight loss at 72 weeks would be category-defining.
- What does the cardiovascular safety profile look like at scale? Particularly the heart-rate signal characterized in Phase II.
- How does the weight-loss curve evolve past 48 weeks? Does it plateau like SURMOUNT-1’s curve around week 60–72, or does it continue declining?
- What does the GI tolerability profile look like with optimized titration? The question is whether discontinuation rates approach tirzepatide’s or remain meaningfully higher.
- What does maintenance look like? SURMOUNT-4-style withdrawal trials will need to characterize retatrutide’s discontinuation curve.
- What does the MASH-specific signal look like? This is where the glucagon arm becomes potentially differentiated rather than just additive.
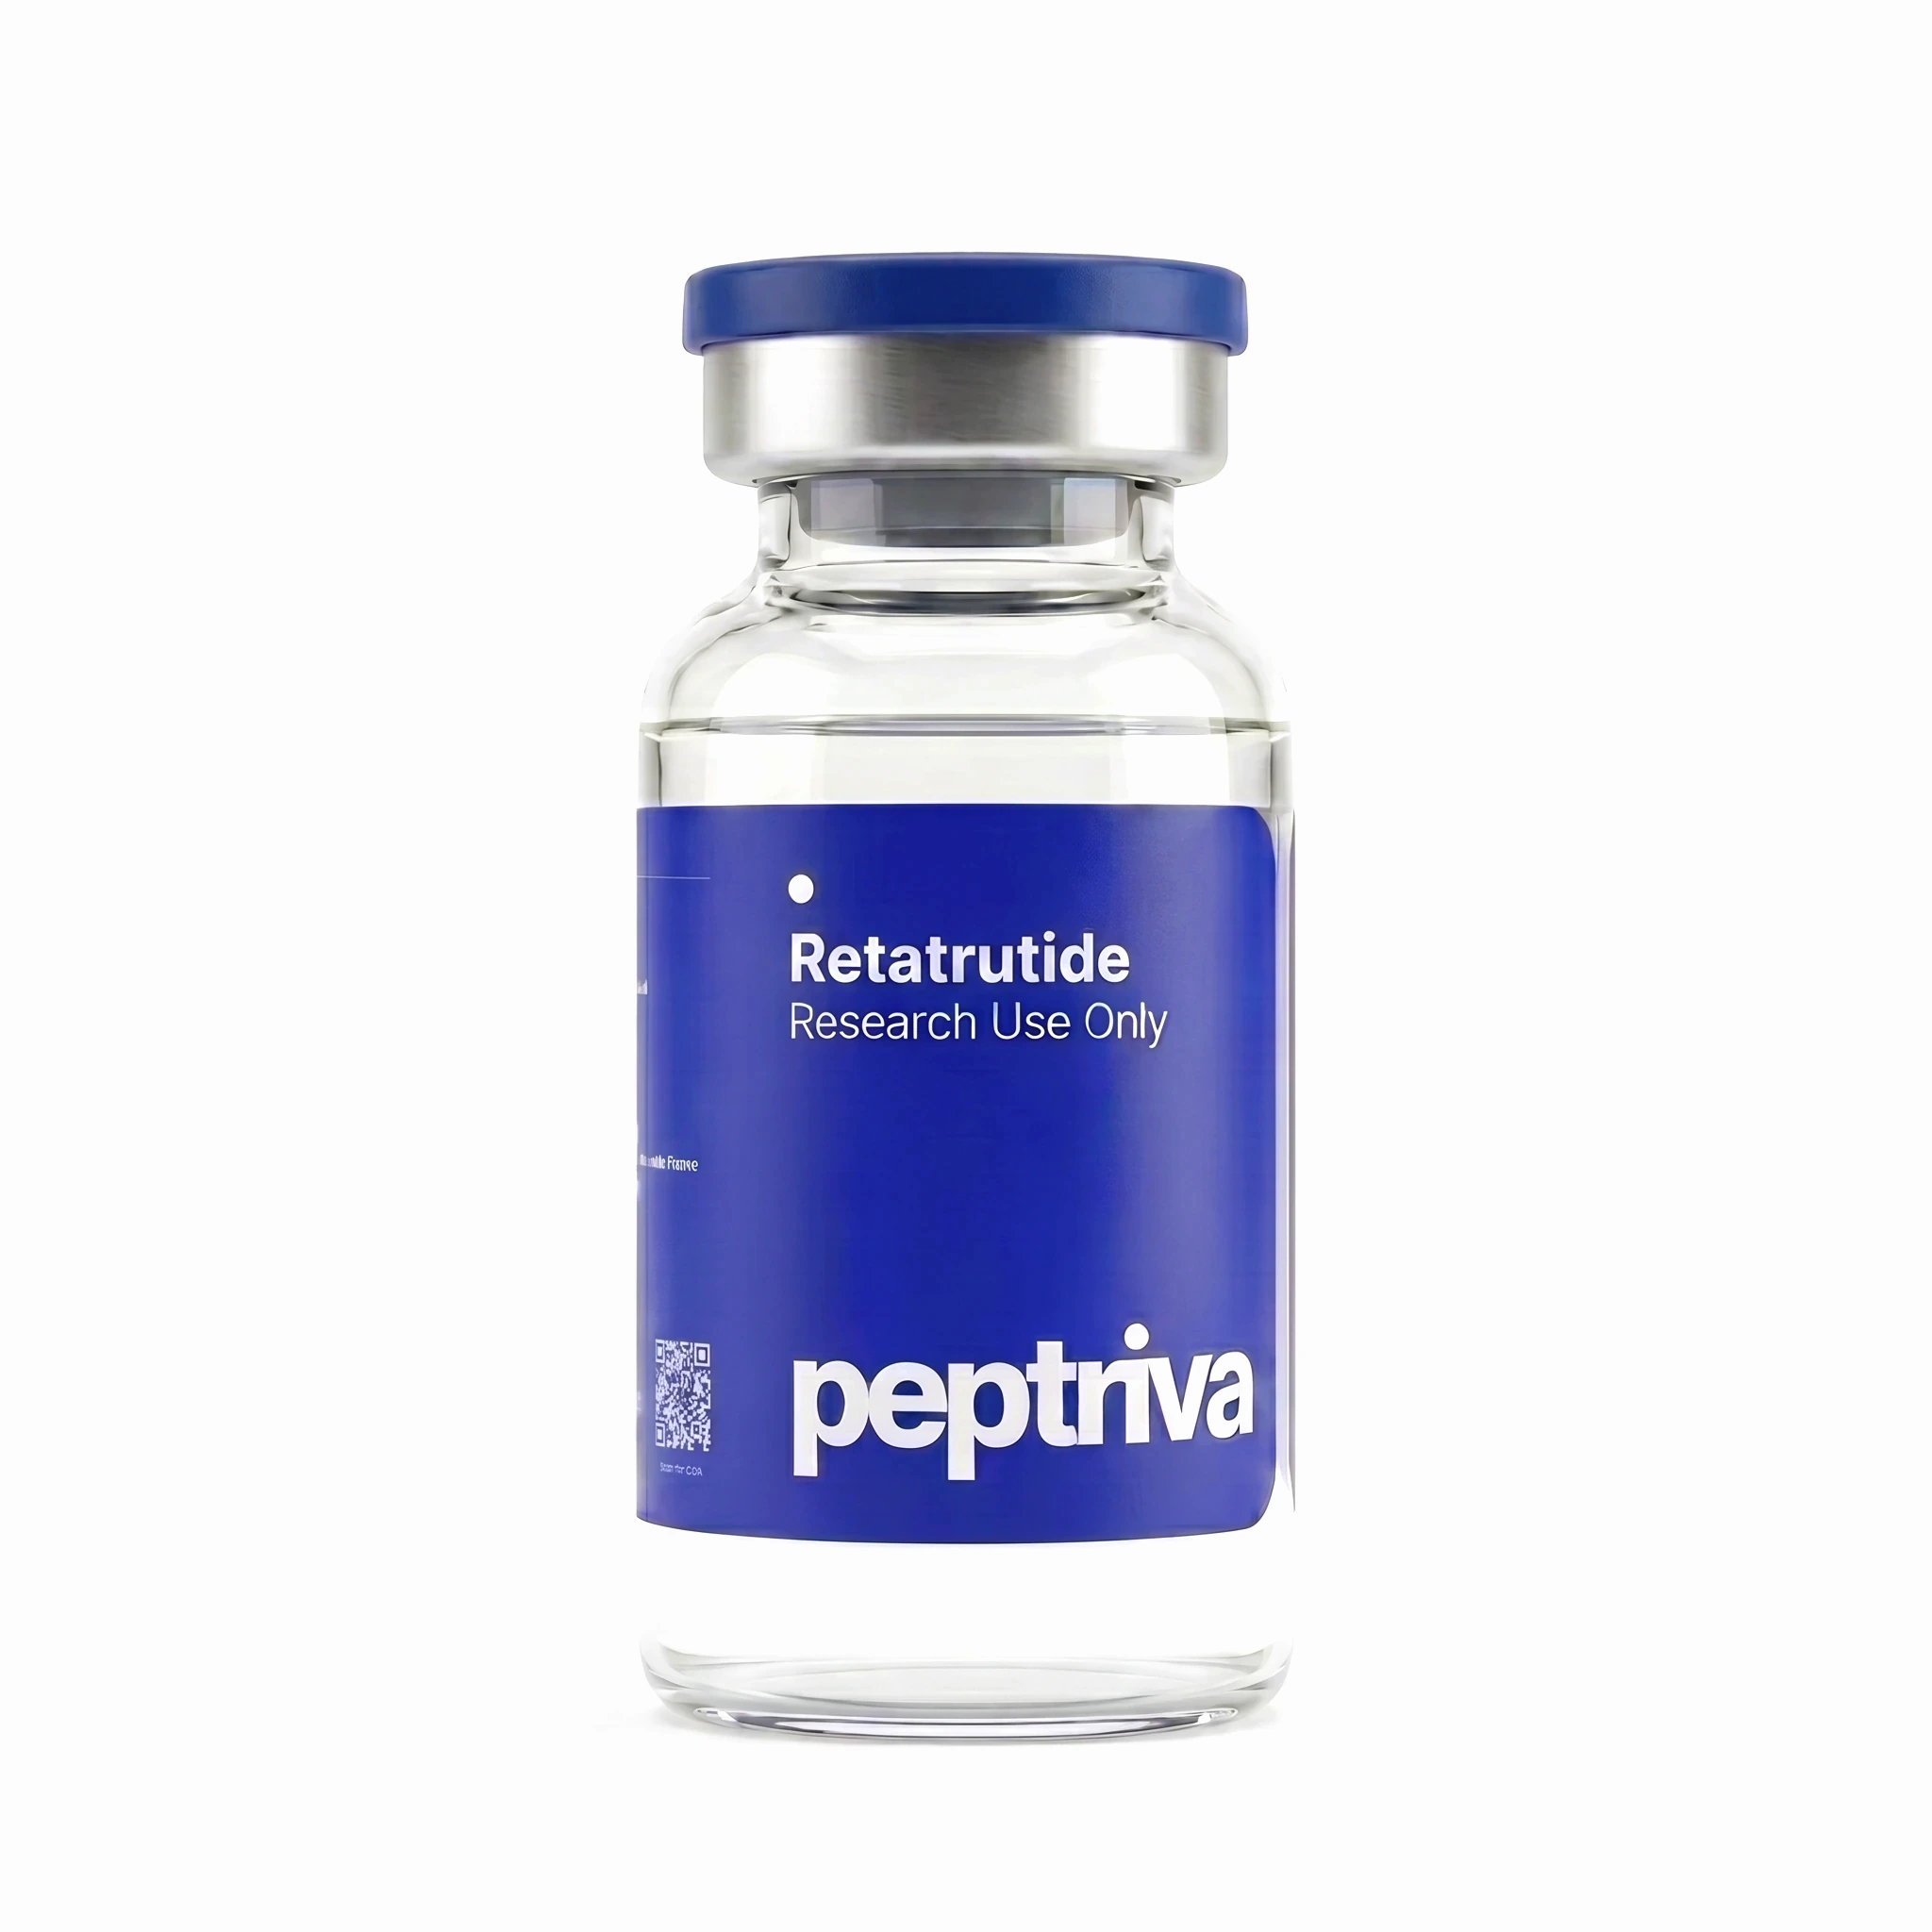
Retatrutide
39-aa triple agonist with C20 fatty-diacid acyl chain. The same reference compound used across the cited Phase II trial. COA available with each lot.
Regulatory status and development timeline
Retatrutide is not approved for clinical use as of 2026. The compound is under active investigation in the Phase III TRIUMPH program, which is enrolling study participants across obesity and metabolic disease cohorts.
Key milestones the research and regulatory community is tracking:
- Response-rate patterns across the GLP-1 class: Clinical investigators have noted that response to approved dual-agonist therapy (tirzepatide) may inform subject selection for future retatrutide research cohorts.
- TRIUMPH enrollment status: Phase III sites have been actively recruiting study participants. Trial enrollment represents the current pathway through which retatrutide is being investigated in human subjects.
- Projected development timeline: Phase III primary readouts are anticipated in 2026–2027; regulatory submission is projected for 2027–2028; potential approval window 2028–2029, contingent on Phase III outcomes.
- Cardiovascular monitoring in multi-agonist research: The heart-rate signal characterized in the Phase II trial has prompted tighter cardiovascular monitoring protocols in ongoing multi-agonist studies across the GLP-1 class.
What to know now
- Trial design: 338 adults, five arms (placebo, 1 mg, 4 mg, 8 mg, 12 mg), 48 weeks.
- Headline result: 24.2% mean weight loss on retatrutide 12 mg vs. 2.1% on placebo.
- Threshold response at 12 mg: 100% reached ≥5%, 83% reached ≥15%, 63% reached ≥20%, 48% reached ≥25%.
- Tolerability: GI events ~80–85% at 12 mg, mostly mild-to-moderate; ~6–16% discontinuation across active arms.
- Heart-rate signal: dose-dependent increase peaking at week 24, declining toward baseline by week 48. Phase III TRIUMPH will characterize at scale.
- Cross-trial caveat: Phase II vs. Phase III comparisons systematically favor Phase II; the 24.2% number may regress modestly in TRIUMPH.
- Regulatory status: not approved. Phase III TRIUMPH ongoing. Realistic approval window 2028–2029.
What we’re watching
4 things over the next 24 months. First, the TRIUMPH-1 obesity readout. Whether 24.2% holds up at scale or regresses toward the tirzepatide ceiling. Second, the cardiovascular safety profile in 5,000+ participants, particularly the heart-rate signal characterization. Third, the maintenance and withdrawal data, the SURMOUNT-4 analog for retatrutide. Fourth, the MASH-specific Phase III readout. Whether retatrutide produces differentiated hepatic outcomes vs. tirzepatide, which would establish triple-agonism as more than just additive.
References
- Jastreboff, A. M., Kaplan, L. M., Frías, J. P., et al. (2023). Triple-hormone-receptor agonist retatrutide for obesity — A Phase 2 trial. New England Journal of Medicine, 389(6), 514–526. https://doi.org/10.1056/NEJMoa2301972
- Jastreboff, A. M., Aronne, L. J., Ahmad, N. N., et al. (2022). Tirzepatide once weekly for the treatment of obesity. New England Journal of Medicine, 387(3), 205–216. https://doi.org/10.1056/NEJMoa2206038
- Aronne, L. J., Sattar, N., Horn, D. B., et al. (2024). Continued treatment with tirzepatide for maintenance of weight reduction in adults with obesity: The SURMOUNT-4 randomized clinical trial. JAMA, 331(1), 38–48. https://doi.org/10.1001/jama.2023.24945
- Melson, E., Ashraf, U., Papamargaritis, D., & Davies, M. J. (2024). What is the pipeline for future medications for obesity? International Journal of Obesity, 49(3), 433–451. https://doi.org/10.1038/s41366-024-01473-y